Mapping the City: A Stranger's Guide
Types of Maps
Map Projections
Flat map projections historically have been grouped by equal-area (area preserving), conformal (shape preserving), or equidistant (distance preserving). Each has its advantages and disadvantages, but no group – individually, or in combination – can accurately display our world without distorting some facet.
Globes are the most objective way to portray the Earth’s land and water masses without distorting their true proportions. Because of the Earth’s spherical shape, flat maps inherently cannot correctly project land masses as they appear curved in spherical form. Although globes do not necessarily distort geography through their projections, they do have implications on how the people perceive the world, having historically served as symbols of power, wealth, globalization, and imperialism.
The rhumb lines that make up the grid on a spherical globe cannot all intersect at right angles. Gerardus Mercator, a Flemish cartographer and mathematician, created what is now known as the Mercator projection in 1569. His projection would help navigators determine more precise bearings to reach their destinations more efficiently than sailing in series of constant bearings. The conformal Mercator projection superimposes a grid with all right angles onto a flat map. The result is a map with increasingly distorted proportions in areas further away from the equator, which appear too large in comparison to the masses near the equator. Although historically the Mercator projection has been the most frequently used, its carries ethical implications for misrepresenting developing countries closer to the equator.
A more recently accepted flat projection of the earth is the Gall-Peters. Created in an attempt to show the world in a more equitable manner, the Gall-Peters projection utilizes a cylindrical equal-area presentation, thus creating more proportionate land masses in terms of flat representation. Distortion also occurs near the north and south poles of the Gall-Peters projection, although here the land masses are presented as smaller than they should appear.
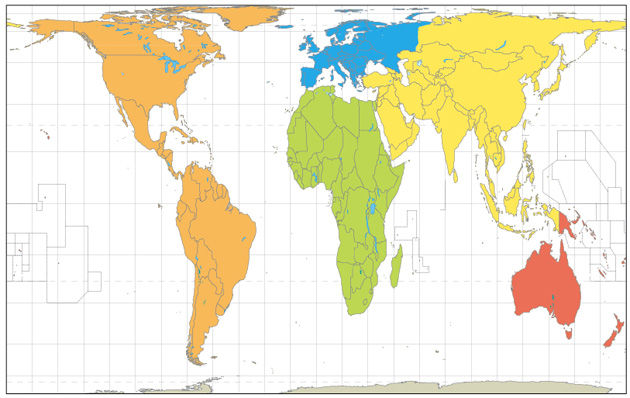
The Winkel-Tripel projection is named ‘tripel’ because it presents a combination of equal-area, conformal, and equidistant projections in an effort to minimize the distortions caused by each. As of 1998 it is the official map used by the National Geographic Society. The Winkel-Tripel projection also features rounded borders, as many organizations have advocated against the use of rectangular representations due to their increased distortions.
Type of Representation
T-O Maps
T-O maps, created in the Middle Ages, present the ancient world as a flat “O” with the three main bodies of water creating a “T” inside. The Don and Nile Rivers converge to make the top bar of the “T” and the Mediterranean constituted the upright bar. The three intersected at the Holy Land and separated the three known continents at the time: Asia, Africa, and Europe.
GIS (geographical information systems) have drastically changed the field of cartography. With the advent of the computer and satellites that collect images, snapshot-like maps have increased the specificity and functionality of maps, especially in the military. GIS are programs designed to store, analyze, and manipulate geographical data to automate maps.
Thematic
“Thematic” is one of the more general classifications of a map. Thematic maps can convey any number of themes such as human, climate, geographic, economic, transportation, boundary characteristics, and many more.
Political maps show significant cities and bodies of water and the governmental boundaries of territories, usually differentiating by use of color. Globes typically show a political representation, outlining each country and major cities.
Topographic maps are graphic representations showing relief by using contour lines to convey elevation, and natural land features, bodies of water, and manmade features.
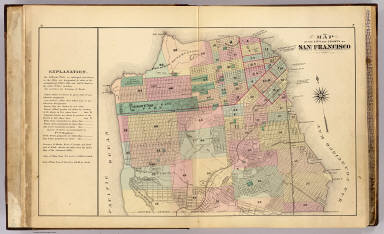
Cadastral maps show areas, boundaries, and sometime values of particular parcels of land. Because of their original use for deed rights and taxation purposes, cadastral maps typically express highly accurate scale.
A climate map shows the relationships and differences in climate for a particular area. Each map considers a number of different aspects such as average precipitation, temperature, and other meteorological factors to determine different climate classifications.
Charts
Charts, as opposed to maps, are working documents. While maps are used for navigation, charts are used for plotting positions, courses, and marking bearings.
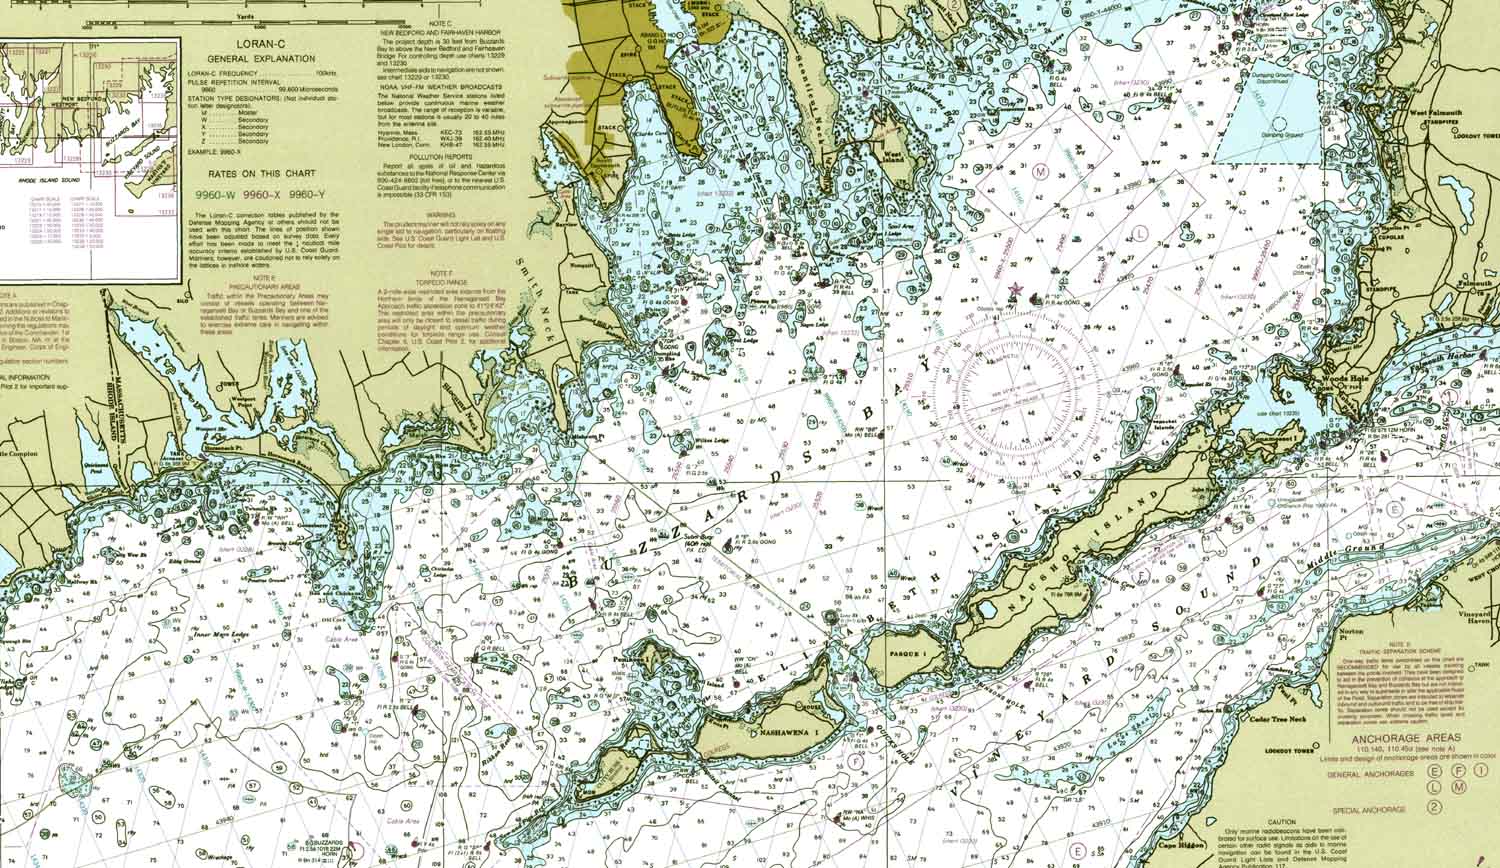
Nautical charts, depending on their scale, show the characteristics of bodies of water useful for navigation. Tides, currents, manmade and natural reference points, harbors, coastline details, hazards, and seabed features are just a few of the facets a nautical chart might display.
Portolan Charts
Portolan charts are a type of nautical chart typically used by European countries starting in the 13th century. These maps are characterized by intersecting rhumb lines in any sort of pattern radiating in the different directions of a mariner’s compass.
Aeronautical Charts
Aeronautical charts perform similar functions as nautical charts. They serve pilots by showing airspace and radio frequency boundaries, safe altitudes, landing areas, and navigational reference points.
Distortive Maps
These maps represent information about a given area, but prioritize representation of the informational set rather than physical geography.
Topological
Topological maps are typically oversimplified representations used to emphasize a certain informational set. Topological maps usually lack a uniform scale, but maintain a general relationship between reference points. The most common examples of topological maps are subway maps - they favor uniformity between stations rather than geographic accuracy in an effort to improve clarity and readability.
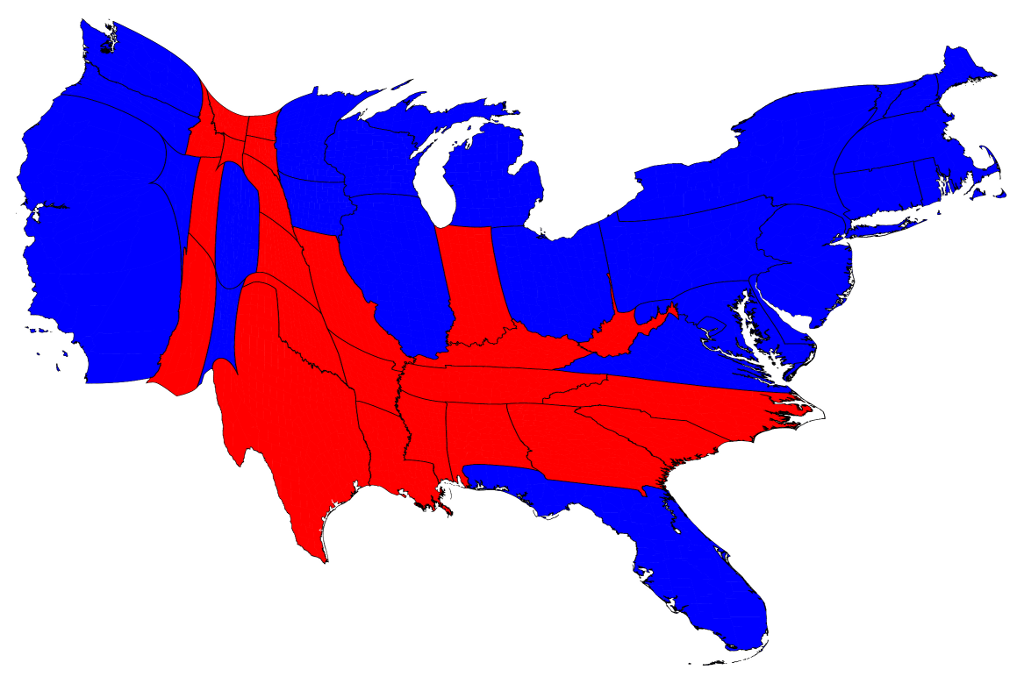
Cartograms are maps in which area is distorted to convey a relative area or distance relationship of a certain thematic variable. Results of presidential elections are often represented as cartograms that use area to proportionately convey the number of electoral votes each respective state has.
Bibliography
Dekker, Elly. “Globes in Renaissance Chart Tradition in the Mediterranean.” In The History of Cartography, v. 3, pt. 1, ed. David Woodward, 135-173. Chicago: University of Chicago Press, 2007.
Harris, Nathaniel. Mapping the World: Maps and their History. San Diego: Thunder Bay Press, 2002.
Raisz, Erwin. Principles of Cartography. New York: McGraw-Hill Book Company, Inc., 1962.
Ramaswamy, Sumathi. “Conceit of the Globe in Mughal Visual Practice.” Comparative Studies in Society and History 49, no. 4, Oct. 2007.
Snyder, John. Flattening the Earth: Two Thousand Years of Map Projections. Chicago: University of Chicago Press, 1997.
US Geological Survey. “Reading Topographic Map Symbols.” US Geological Survey website. http://egsc.usgs.gov/isb/pubs/booklets/symbols/reading.html
US Geological Survey. “Map Projections.” US Geological Survey website. http://egsc.usgs.gov/isb/pubs/MapProjections/projections.html
wiseGEEK. “What is a Political Map?” Conjecture Corporation.http://www.wisegeek.org/what-is-a-political-map.htm
wiseGEEK. “What is a Topological Map?” Conjecture Corporation.http://www.wisegeek.com/what-is-a-topological-map.htm
Information about Maps Shown in Links
Aeronautical Chart: “Aeronautical Chart”. Addison Airport.http://addisonairport.websitehome.net/pilots/index.htm
Winkel-Tripel Projection: Bartholomew, John. “World Climatology. Plate 3, v.1.” Map. David Rumsey Map Collection. John Bartholomew & Son, 1958.
Topological: Beck, Harry. “Underground Map.” Map. Transport for London. Underground Electric Railways of London, 1933.
Topographic: California State Earthquake Investigation Commission. “Palmdale quadrangle showing San Andreas Rift.” Map. David Rumsey Map Collection. Carnegie Institution, 1908.
Mercator Projection: Johnson, D. Griffing. “World On Mercator’s Projection.” Map. David Rumsey Map Collection. D. Griffing Johnson, 1847.
Portolan Charts: “La Isola di Candia [The Island of Crete]”. Map. Cosmographia, Agnese, Battista. Venice, 1559. Yale University Beniecke Rare Book and Manuscript Library.
Nautical Chart:“Nautical Map of South and Central Buzzards Bay”. Buzzards Bay National Estuary Program. http://buzzardsbay.org/nautical.htm
Gall-Peters Projection:“Peters 1973.” Map. The Guardian. The Guardian (UK), 2009.
Globe: Rand McNally & Co. “Rand, McNally & Co’s New Eight-Inch Terrestrial Globe.” Globe. David Rumsey Map Collection. Rand McNally, 1909.
T-O Map: Richard of Haldingham. “Hereford Mappa Mundi.” Map. Hereford Cathedral. c. 1300.
Political Map: Smiley, Thomas. “Middle States.” Map. David Rumsey Map Collection. Hogan & Thompson, 1842.
Cartogram:“State Electoral Votes.” Map. Maps of the 2012 US presidential election results. University of Michigan, 2012.
Cadastral (Plat) Map: William P. Humphreys & Co. “San Francisco.” Map. David Rumsey Map Collection. W. Humphreys, 1876.
Climate Map: World Climate Map, www.theodora.com/maps
Some materials and descriptions may include offensive content. More info